
Quality assurance program
L.A. Baker, B.C. Asleson, A.J. Erickson, and R.M. Hozalski
Taylor (1987) defines quality assurance as the “system of activities whose purpose is to provide to the producer or user of a product or a service the assurance that it meets defined standards of quality with a stated level of confidence.” Quality assurance has two components: quality control and quality assessment. Quality control is the process of minimizing errors in sample handling and analysis. Quality assessment is the quantification of errors and comparison of errors to acceptability standards. For stormwater assessment and maintenance, quality assurance is important for all assessment processes (e.g., sample collection, sample analysis, flow measurement, pollutant load calculations, etc.) to ensure proper conclusions about performance and proper selection and scheduling of maintenance.
Many assessment programs will require sample collection (see Sampling Methods) and analysis. Some assessment program managers may lack access to the proper equipment or expertise to conduct sample analysis and therefore choose to send samples to commercial or government laboratories for analysis. In some cases, regulatory agencies require the use of ‘certified’ analysis laboratories to ensure strict adherence to standardized methods such as Standard Methods for the Examination of Water and Wastewater (A.P.H.A. 1998b), the American Society of Testing and Materials (A.S.T.M.), or U.S. EPA approved methods (Nelson 2003). In Minnesota, the Department of Health maintains a list of certified analytical laboratories that provide analysis services at a level appropriate for certification by the State.
Commercial or government laboratories often make use of quality assurance programs, but these programs assure only the quality of the analytical result for the sample(s) submitted to the laboratory. The laboratory cannot assure that samples are representative or were collected and handled properly (see Sample handling). Assessment programs that do not use commercial or government laboratories for analysis must also include quality assurance for sample analysis as well as sample collection and handling. Therefore, the assessment program manager is responsible for developing, implementing, and enforcing a quality assurance (QA) program. The quality assurance program must start with sample collection and proceed through sample processing, lab analysis, and validation of results.
Quality control
Quality control is the process of minimizing errors in sample collection, handling and analysis. Minimizing errors in sample collection, handling, and analysis can be achieved by choosing standard recognized methods and performing those methods consistently. The following three steps can be used to provide quality control for sample collection, handling, and analysis: Sample Procedure Documentation, Personnel Training, and Compliance.
Sample procedure documentation includes information on sample collection, handling, and analysis. Documentation of sample procedures should include sufficient detail such that the sampling and analysis program can be replicated by an individual unfamiliar with the assessment program (i.e., third party). This will ensure that the program can be continued by a third party, if necessary, or can be replicated at a different location to facilitate comparison between two or more sites. Documentation at this level of detail also ensures that the program is consistent regardless of personnel changes or length of time.
Sample procedures should be documented before commencing an assessment program to ensure measurements throughout the program are comparable. Any changes to the procedures should be noted in the documentation along with the time frame to which the changes are effective. Documentation of sample procedures is commonly compiled into a guidance manual that could include the following:
- Field sampling methods: sampling locations, methods, measurements, equipment, etc.,
- Preparation of samples (pre-cleaning of bottles, filtration, storage, etc.),
- Labeling and chain-of-custody procedures,
- Analytical methods, including any modifications of test procedures from standard conditions, and
- Safety protocols.
Personnel should be properly trained on sampling procedures to ensure consistent and quality controlled sampling. Use the documentation of sampling procedures to ensure consistent training and to allow personnel to become familiar with the documentation.
Assessment programs should be regularly checked for compliance with the sampling procedures documentation. Compliance will ensure consistent implementation of the sampling procedures and allow for comparison of assessment results between different sites, different time periods, or both. Regularly compliance checks can often quickly identify errors in sampling procedures, equipment, or analysis techniques. If identified quickly and corrected, errors due to non-compliance usually result in minimal loss of data.
Quality assessment
Quality assessment is the quantification of errors and comparison of errors to acceptability standards. Error in sample collection, handling, and analysis is caused by two components: bias and precision. Bias is systematic error that results in sample values that are consistently different than the “true” value, typically by a constant amount. Precision is a measure of the accuracy of sample collection, handling, and analysis. Both precision and bias decrease (i.e., become imprecise and biased) as measurements and analysis results approach the detection limit. Figure 6.5 is an illustration of bias and precision and the following describe how bias and precision are represented by each of the colored clusters.
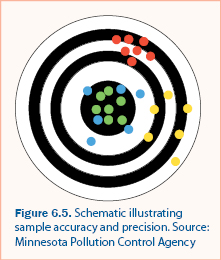
- The Green values are both unbiased and precise. They are all near the true value (center) and relatively close together. This is an optimal sampling procedure.
- The Blue values are unbiased but imprecise. They are near the true value, but there is substantial variability in the values.
- The Red values are precise, but biased. They are close together but consistently different than the true value.
- The Yellow values are both imprecise and biased. They are consistently different than the true value and there is substantial variability in the values.
Bias
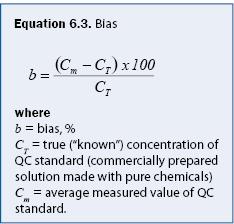
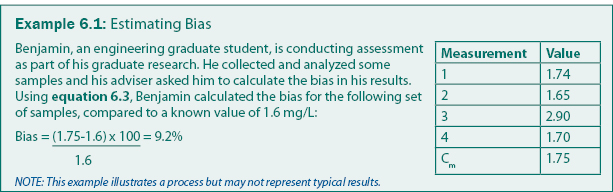
Bias can be calculated using equation 6.3. For water or soils analyses, bias can be introduced in the analytical system (e.g., by contaminated reagents) or in sampling (e.g., by contaminated filters or sample bottles). Analysis bias is generally determined by analyzing samples mixed to standard concentrations (also called “check samples” or “known values”). A common technique is to include check samples regularly and frequently throughout the analysis process (e.g., every 10th sample). An example of how bias can be calculated is given in example 6.1.
A common cause of bias is sample contamination. Bias as a result of contamination can often be determined by analysis of field blanks. Field blanks should be high-purity distilled water, generally provided by the analytical lab. Field blanks are commonly samples of high-purity distilled water that are filtered, stored, labeled, and analyzed according to the sampling procedure documentation. If analysis of field blanks indicates measured values greater than detection limits, contamination is likely occurring in the sampling, handling, or analysis process. Field blanks can be incorporated during each step of the collection, handling, and analysis process to identify the step in which samples are becoming contaminated.
Precision
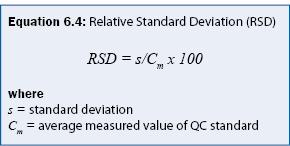
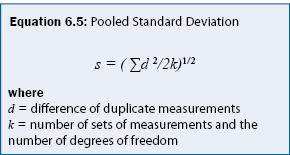
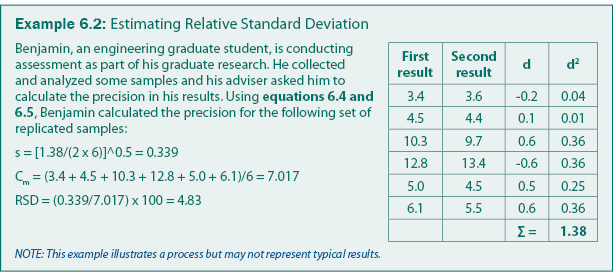
Precision is quantified by repeating analysis on the same sample or on samples with the same concentration. Precision is often calculated as a relative standard deviation as given in equation 6.4. For sampling programs, a common practice is to collect a replicate sample for every 10 samples and estimate the "pooled" standard deviation from equation 6.5. The pooled standard deviation is suitable to field sampling because the mean concentration can typically not be assumed to be constant. An example calculation of precision is given in Example 6.2.
Detection limit
The limit of detection (LOD) is the lowest concentration that can be reliably distinguished from a blank sample (high-purity distilled water). Operationally, the LOD is determined by repeated analysis of a low-level standard to determine the standard deviation (s) and the LOD is calculated as three standard deviations (LOD = 3s). The limit of quantification (LOQ) is the smallest concentration that can be reliably quoted as a measured concentration. The LOQ is typically given as 10 standard deviations (LOQ = 10s). Most standard analytical methods include information on detection limits and quantification limits. Most constituents can be analyzed by more than one analytical method, but methods with smaller LOD are commonly more expensive than methods with a larger LOD. Therefore, selecting an analytical method is often a balance between LOD and cost.
Implementation and verification
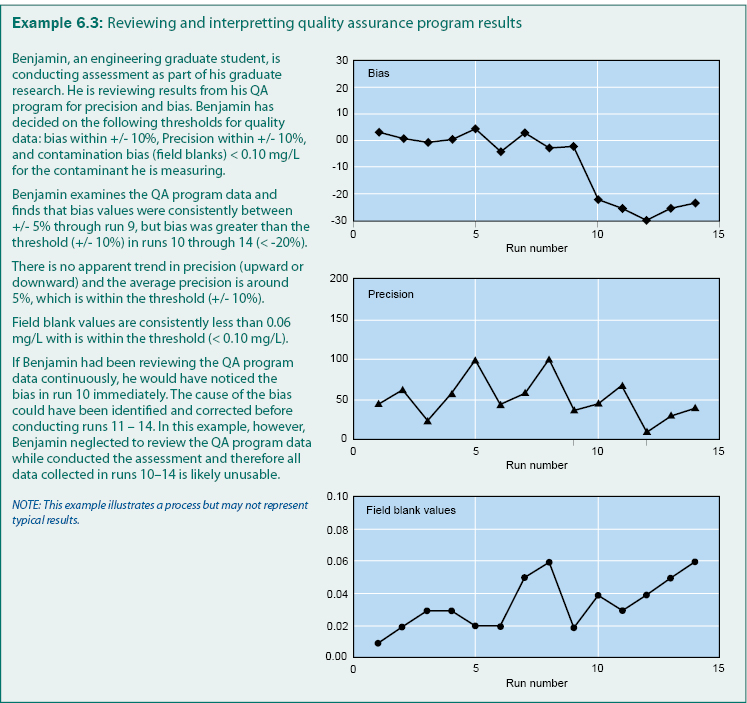
A typical QA program includes analysis of field blanks to determine contamination (bias), replicates to determine precision, and check samples to determine bias. If bias or imprecision is detected during sample collection, handling, or analysis; the sample procedure documentation may need to be revised, personnel may need additional training, or compliance may need stricter enforcement. Example 6.3 is an example of how QA program results can be reviewed to determine bias, precision, and the quality of the gathered data.
Continue to Recommendations.